Today, our digital world is flooded with clicks, likes, searches, and swipes. Each action is captured and sorted into vast digital datasets. To many creatives, these datasets might seem overwhelming, mundane, or impenetrable without the right tools. But imagine that data not as just numbers. Imagine it as the raw material for visual storytelling. In skilled hands, data becomes beautiful, even world-changing. A powerful tool used to build narratives that connect emotionally and inspire action.
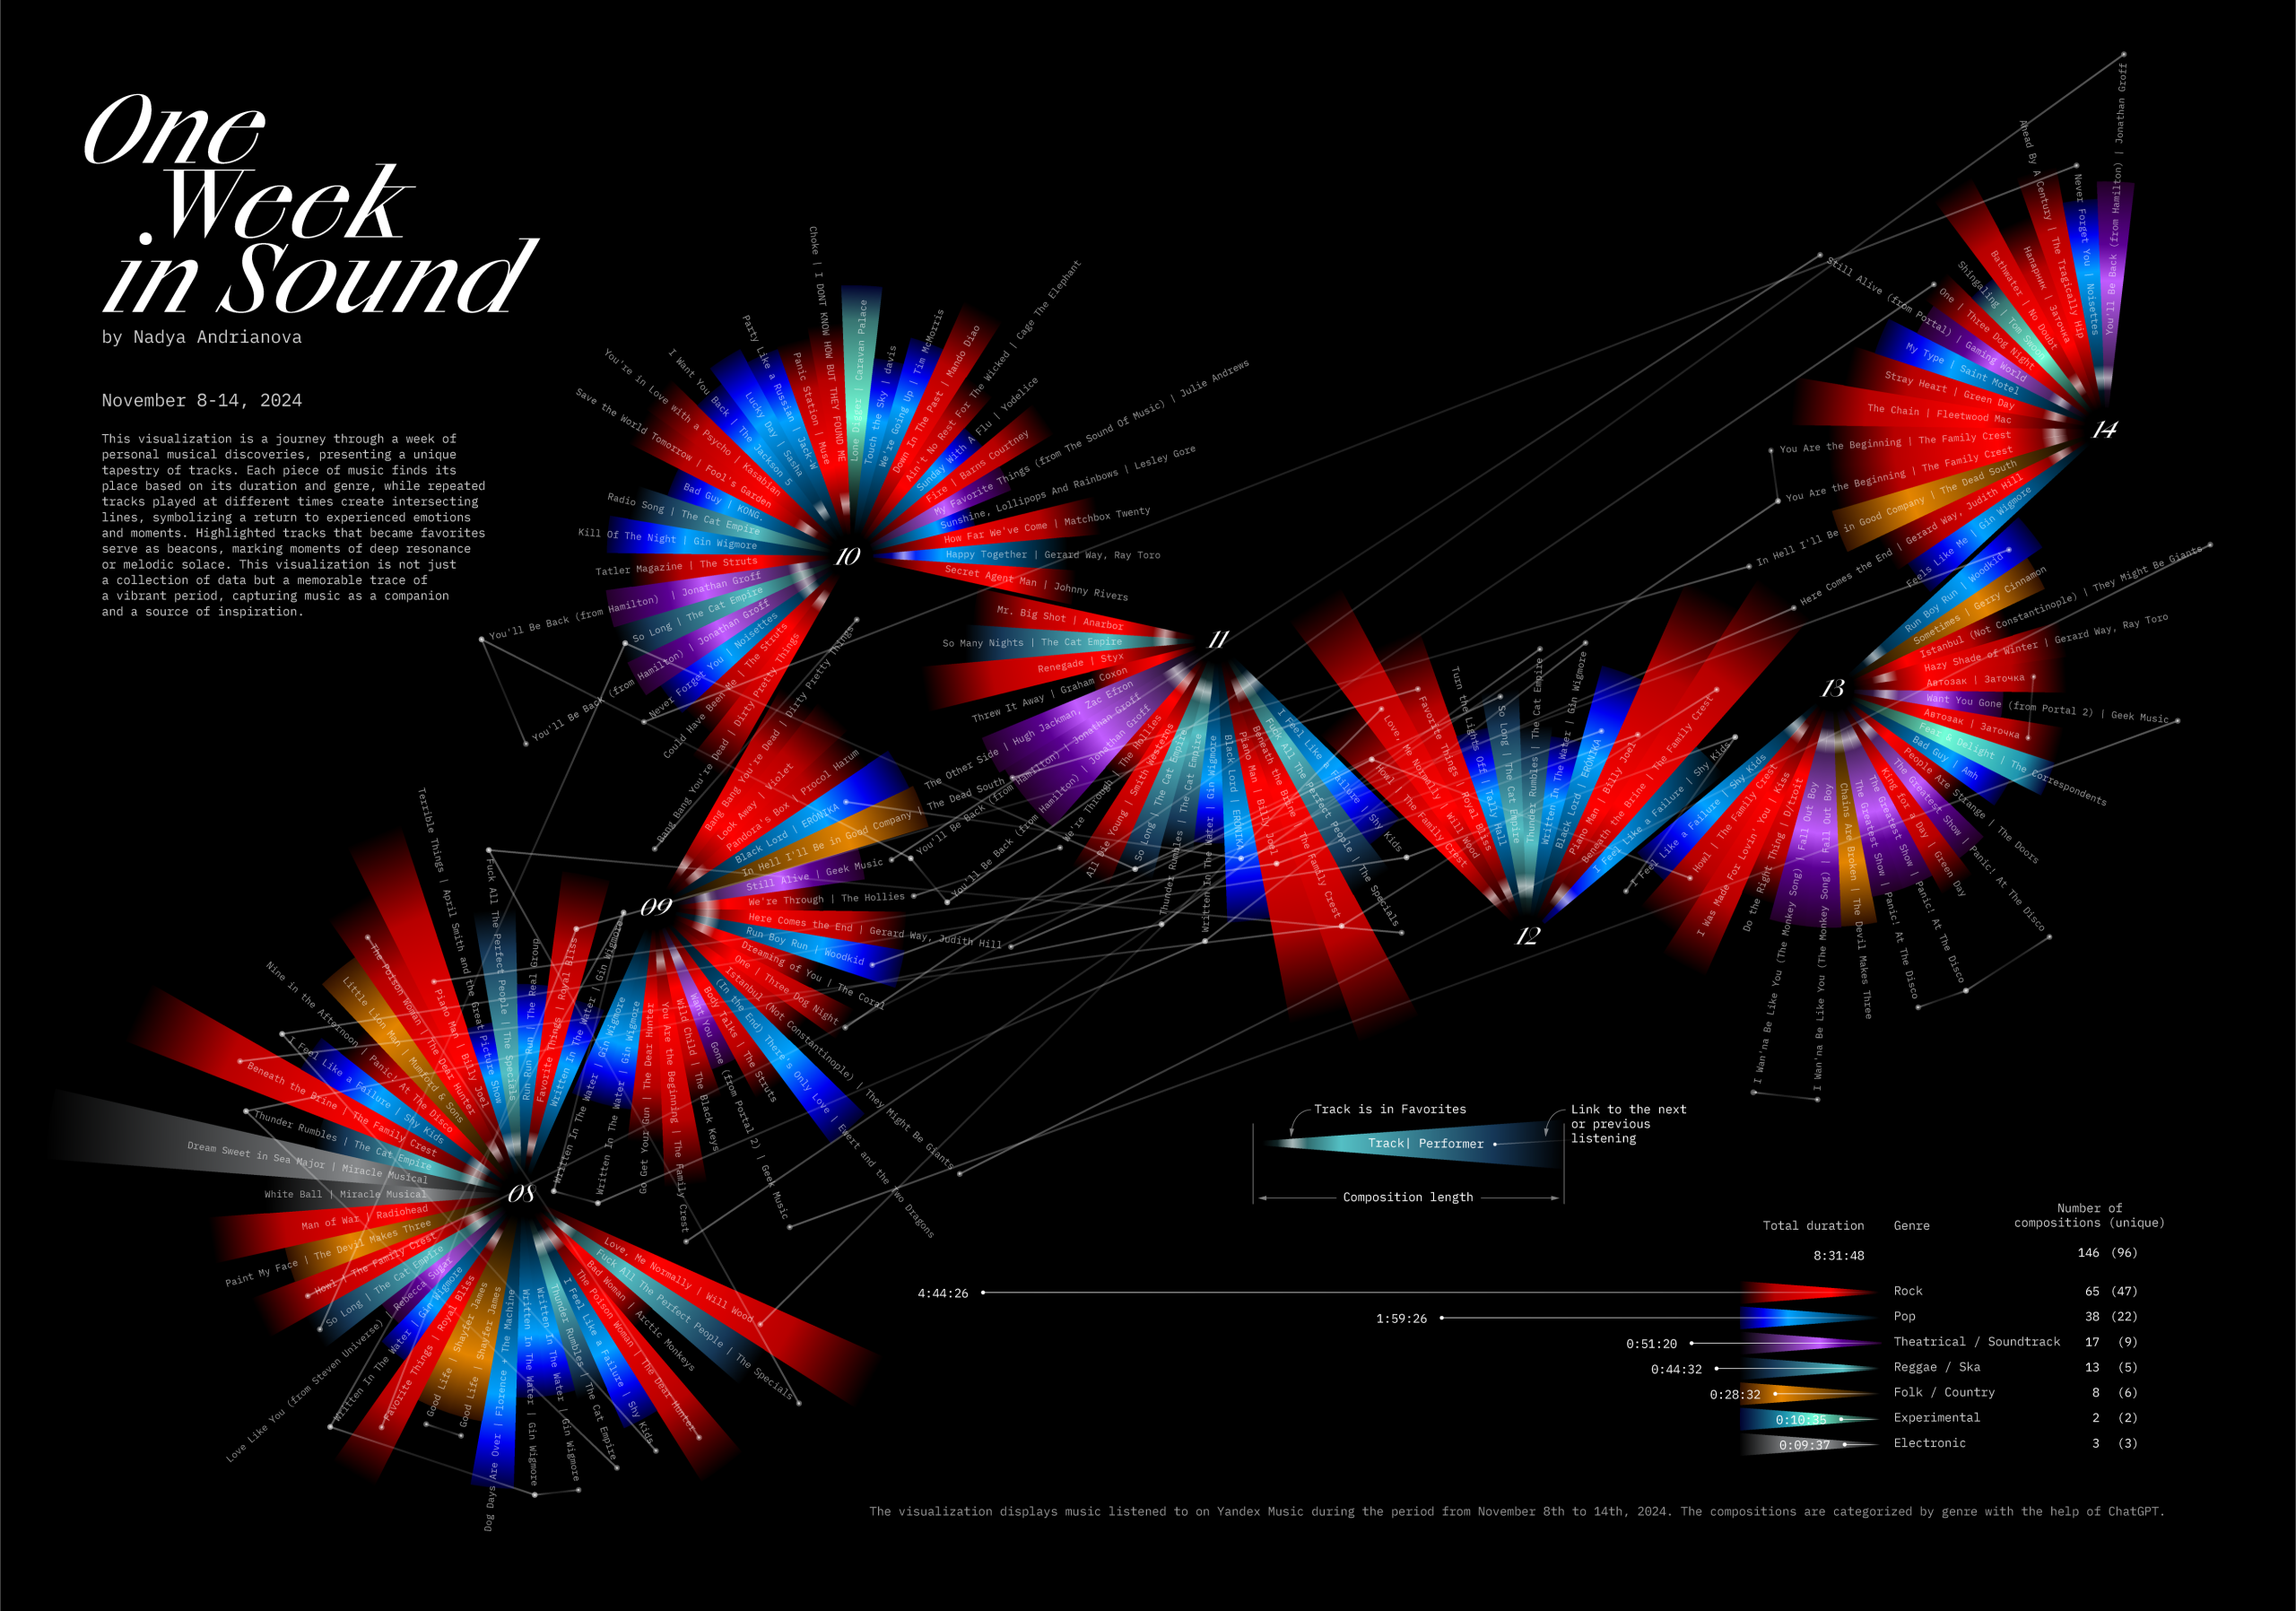
One Week in Sound by Nadezda Andrianova | from informationisbeautifulawards.com
The power of this approach is timeless. In 1854, John Snow’s cholera dot map challenged the miasma theory, proving waterborne transmission and reshaping public health policy. Florence Nightingale’s 1858 polar area diagrams revealed wartime mortality causes, spurring military and hospital reforms across Britain. W.E.B. Du Bois’s hand-drawn visualizations in 1900 countered racist stereotypes, documenting the progress of Black Americans with striking clarity.
These are examples of excellent data stories. They succeeded by disrupting expectations, surprising audiences, and reframing familiar truths (Matei & Hunter, 2021).
Today, visual communicators have access to more data than ever before. With skill, purpose, and ethical design, designers can emulate Snow, Nightingale, and Du Bois, transforming raw numbers into clear, influential narratives. Research, such as studies on narrative persuasion, shows that effective data storytelling engages both mind and heart, allowing audiences to see themselves in the narrative (Matei & Hunter, 2021). This personal connection simplifies complex information, highlights key insights, and makes meaning clear and memorable.
Just as photographers wait for the perfect light, today’s visual communicators can tap into many publicly available datasets to uncover patterns, behaviors, and insights. Data literacy becomes an essential skill to unlock this potential, ensuring ethical practices that protect data integrity and avoid bias.
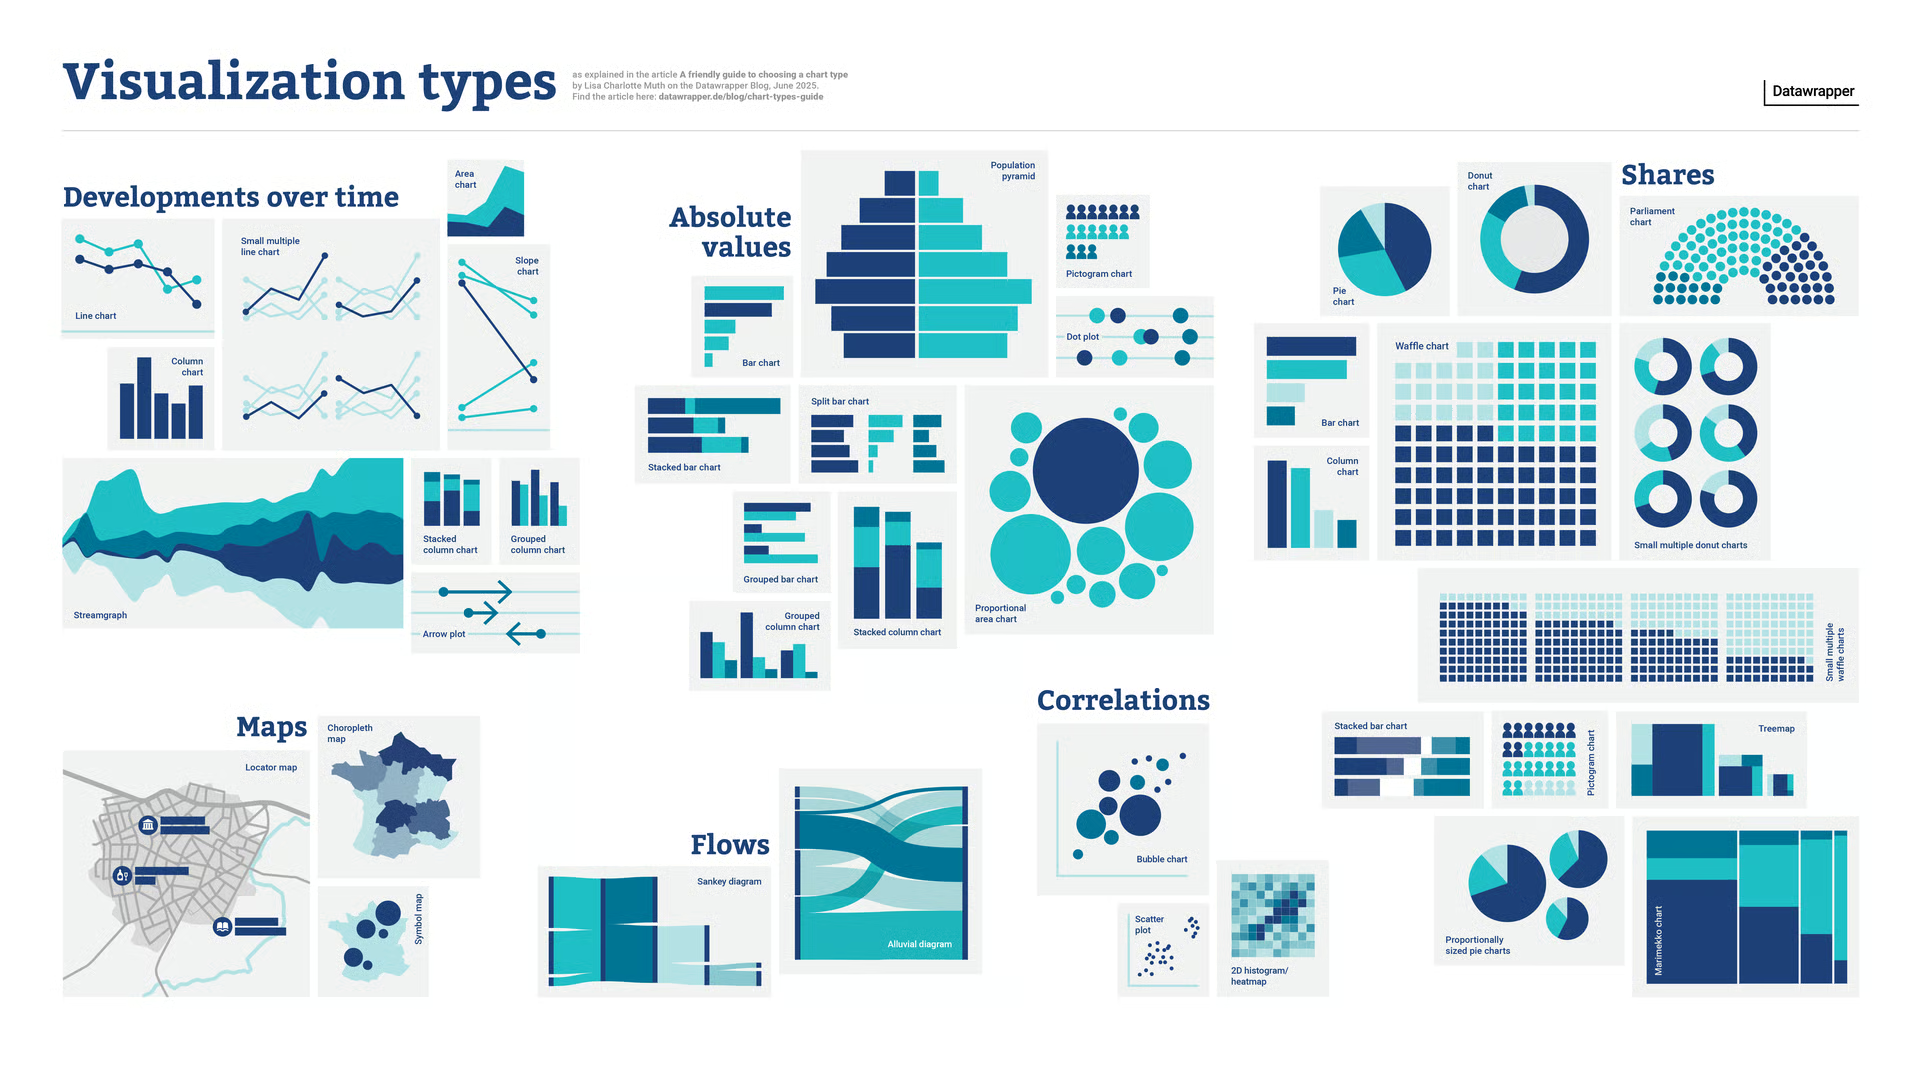
Graphic by Lisa Charlotte Muth | from Datawrapper.de
To shape compelling data stories, designers can tap into tools like Tableau or D3.js for dynamic visualizations, and Adobe Creative Cloud for polished, aesthetic refinement, often collaborating with data experts for complex projects. Interactive elements, such as responsive animations or hover effects, can bring clarity to intricate ideas, engaging audiences.
As visual designers and communicators, we will be expanding our toolkit with these new technical and data literacy skills. But these tools are only effective when they work together with our already established traditional design practices. Principles, like Gestalt, color psychology, typography, and precise chart selection, remain crucial for creating persuasive designs. Without these principles, skills like data literacy and coding fall short.
By combining these skills, we can create ethical narratives that are accurate, persuasive and resistant to manipulation. Our work can turn ordinary numbers into inspiring stories or even world-changing insights.
References
Five charts that changed the world, & BBC Ideas (Director). (2023, May 4).[Video/DVD] YouTube. https://www.youtube.com/watch?v=CqkCUDesG5o
Matei, S. A., & Hunter, L. (2021). Data storytelling is not storytelling with data: A framework for storytelling in science communication and data journalism. The Information Society, 37(5), 312–322. 10.1080/01972243.2021.1951415
Microsoft. (2025). What is data storytelling? https://www.microsoft.com/en-us/power-platform/products/power-bi/topics/data-storytelling
Ovans, A. (2011, Dec 1). The charts that changed the world. Harvard Business Review, 89 https://search.proquest.com/docview/907106428
Reddit. (2025). Data is beautiful. https://www.reddit.com/r/dataisbeautiful/
Tableau. (2025). Free public data sets for analysis. https://www.tableau.com/learn/articles/free-public-data-sets
Wikipedia. (2025, May). John snow. https://en.wikipedia.org/wiki/John_Snow.